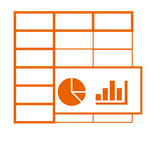
Data for Schools
Data and visualizations for leaders of schools, networks and systems
FERPA-aware, stakeholder-focused


Student performance data in professionally prepared tables and charts
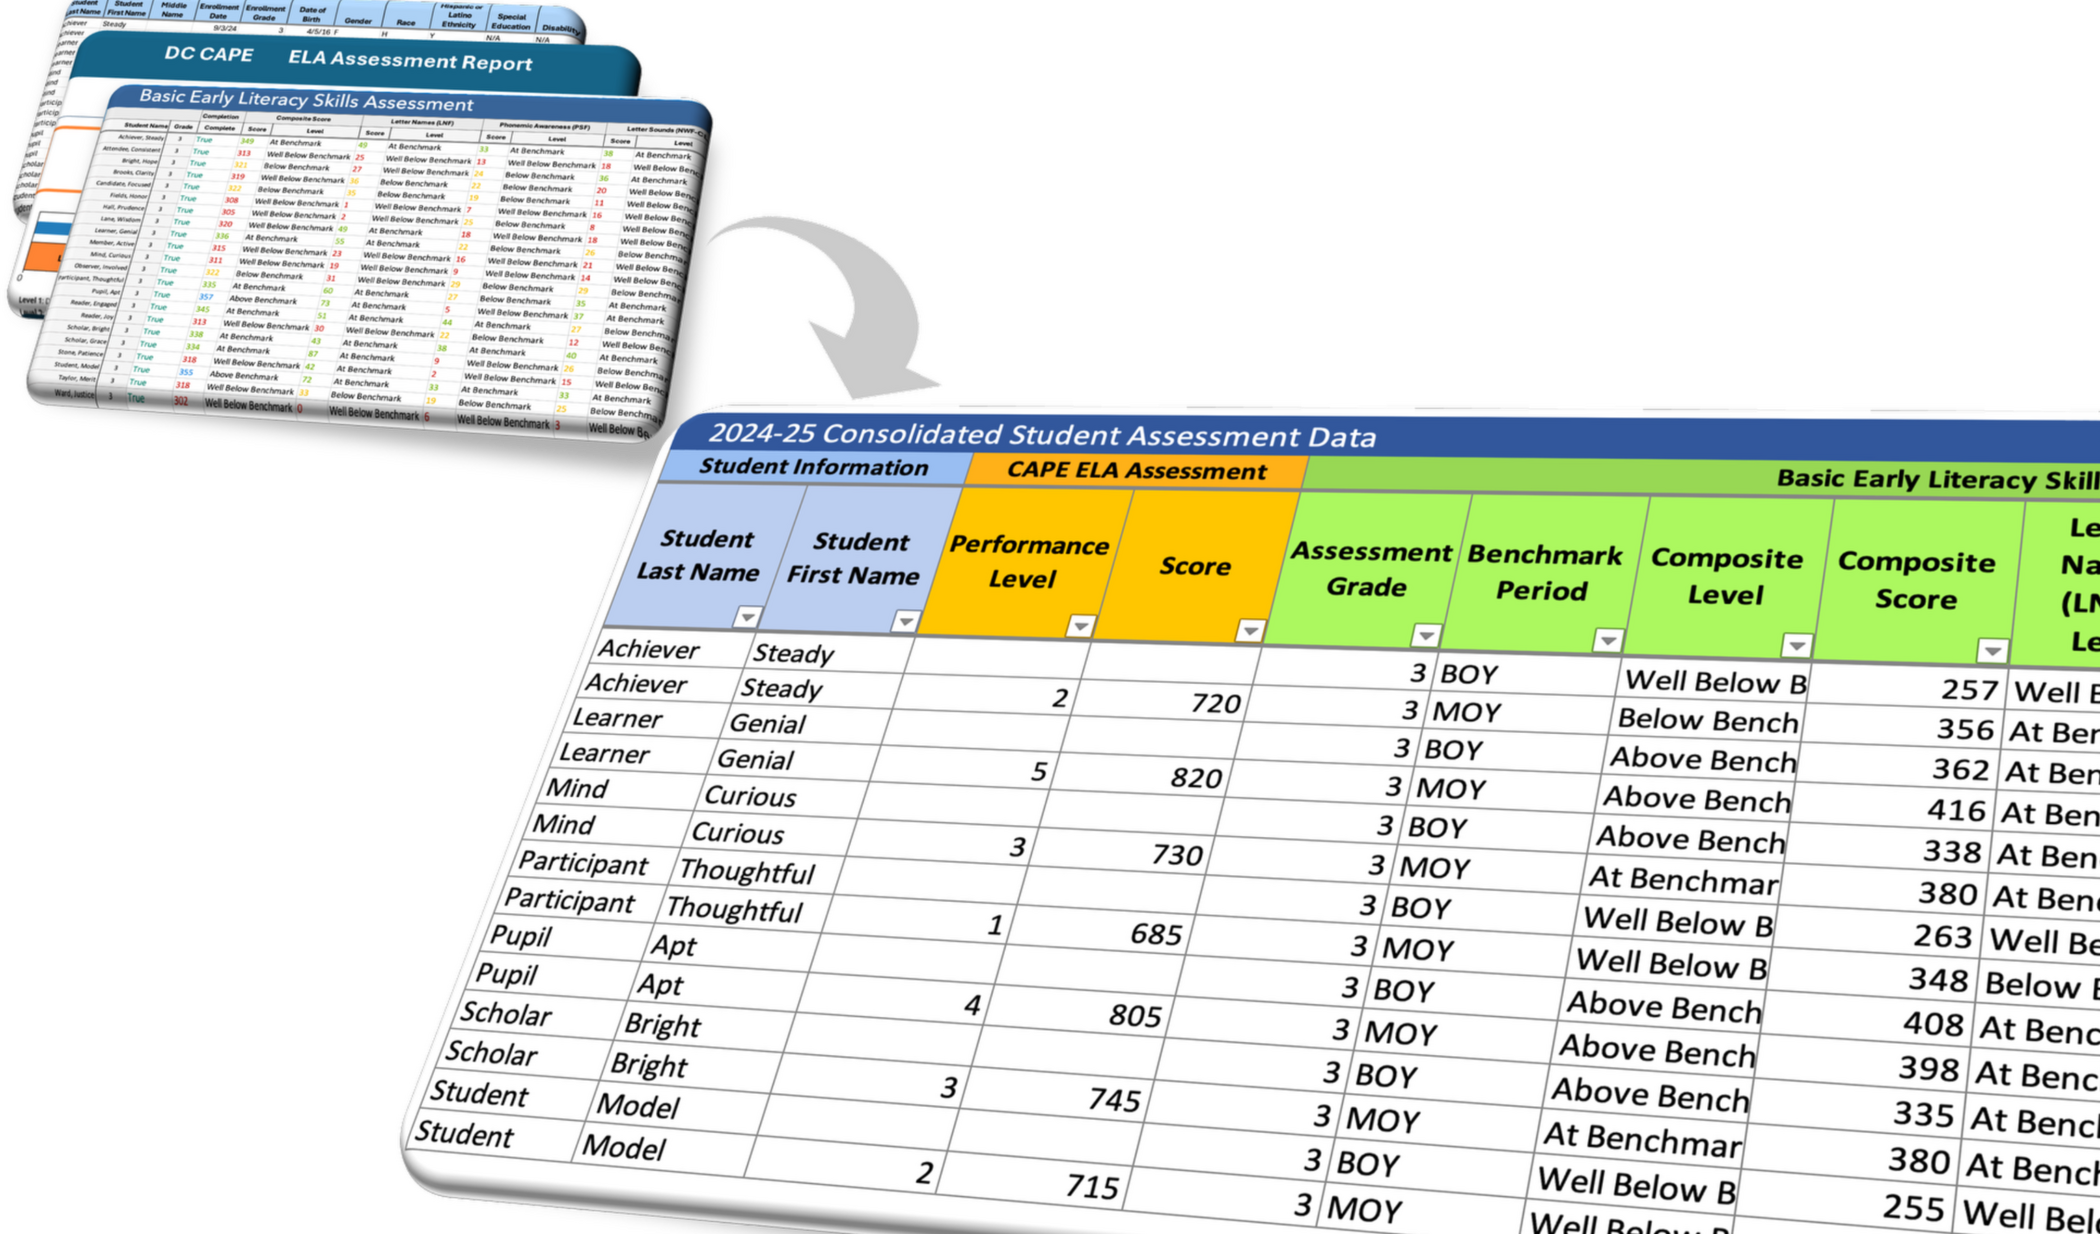
Tables
Data accurately and clearly presented with filters, column headings, heat maps and more. Updates at each assessment period (BOY, MOY, EOY).

Student growth and achievement pulled together from multiple platforms
Universal Screeners
Diagnostic Assessments
Progress Monitoring
Demographic data
DC CAPE
FERPA-aware, focused on data privacy and security.

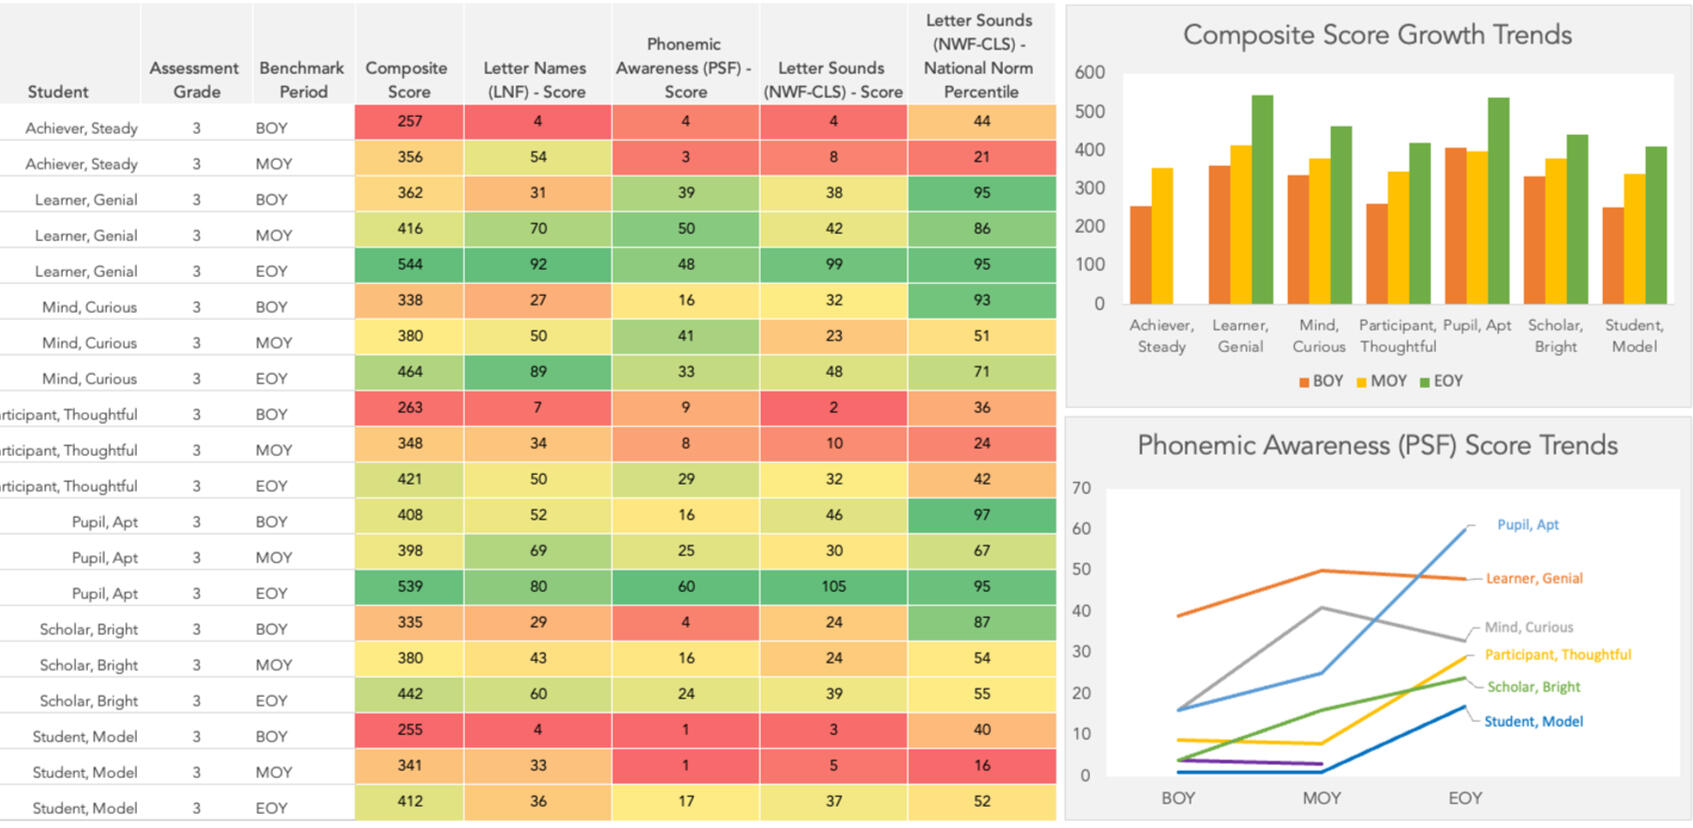
Charts & Dashboards
Visualizations make patterns and trends easy to see, highlighting insights that tables alone can’t. Smart use of color, chart type, and layout makes the data clear and compelling.

Delivered in the formats you already use
Excel, CSV, Word, PowerPoint
Google Sheets, Docs, Slides
PDFs
Python, R, SQL
Work can also be done within client environments such as Tableau and PowerBI

Pricing
I charge a flat hourly rate, so you only pay for the time your project needs.
Most projects include updating a student achievement and growth table plus two charts.
On average, that takes about 3-5 hours per assessment period.
Time required may vary depending on the amount of data and how complex the project is.

Working Together
The process is simple. We focus on understanding your goals and delivering your reports with minimal effort from you.

Let's Talk
Have a project in mind or just a quick question? I’m happy to help.
Initial calls can be as short as 5 minutes — or longer if you’d like.
I’ll follow up within 24 hours. If you have a date and time preference, just note that in the form.
© 2025. All rights reserved.