Data for Schools
Data and visualizations for leaders of schools, networks and systems
FERPA-aware, stakeholder-focused

Student performance data in professionally prepared tables, graphs, and charts
Move away from messy data and clunky spreadsheets
Avoid rushing to data for every new update or presentation
Confidently present clean, accurate datasets and visuals to stakeholders
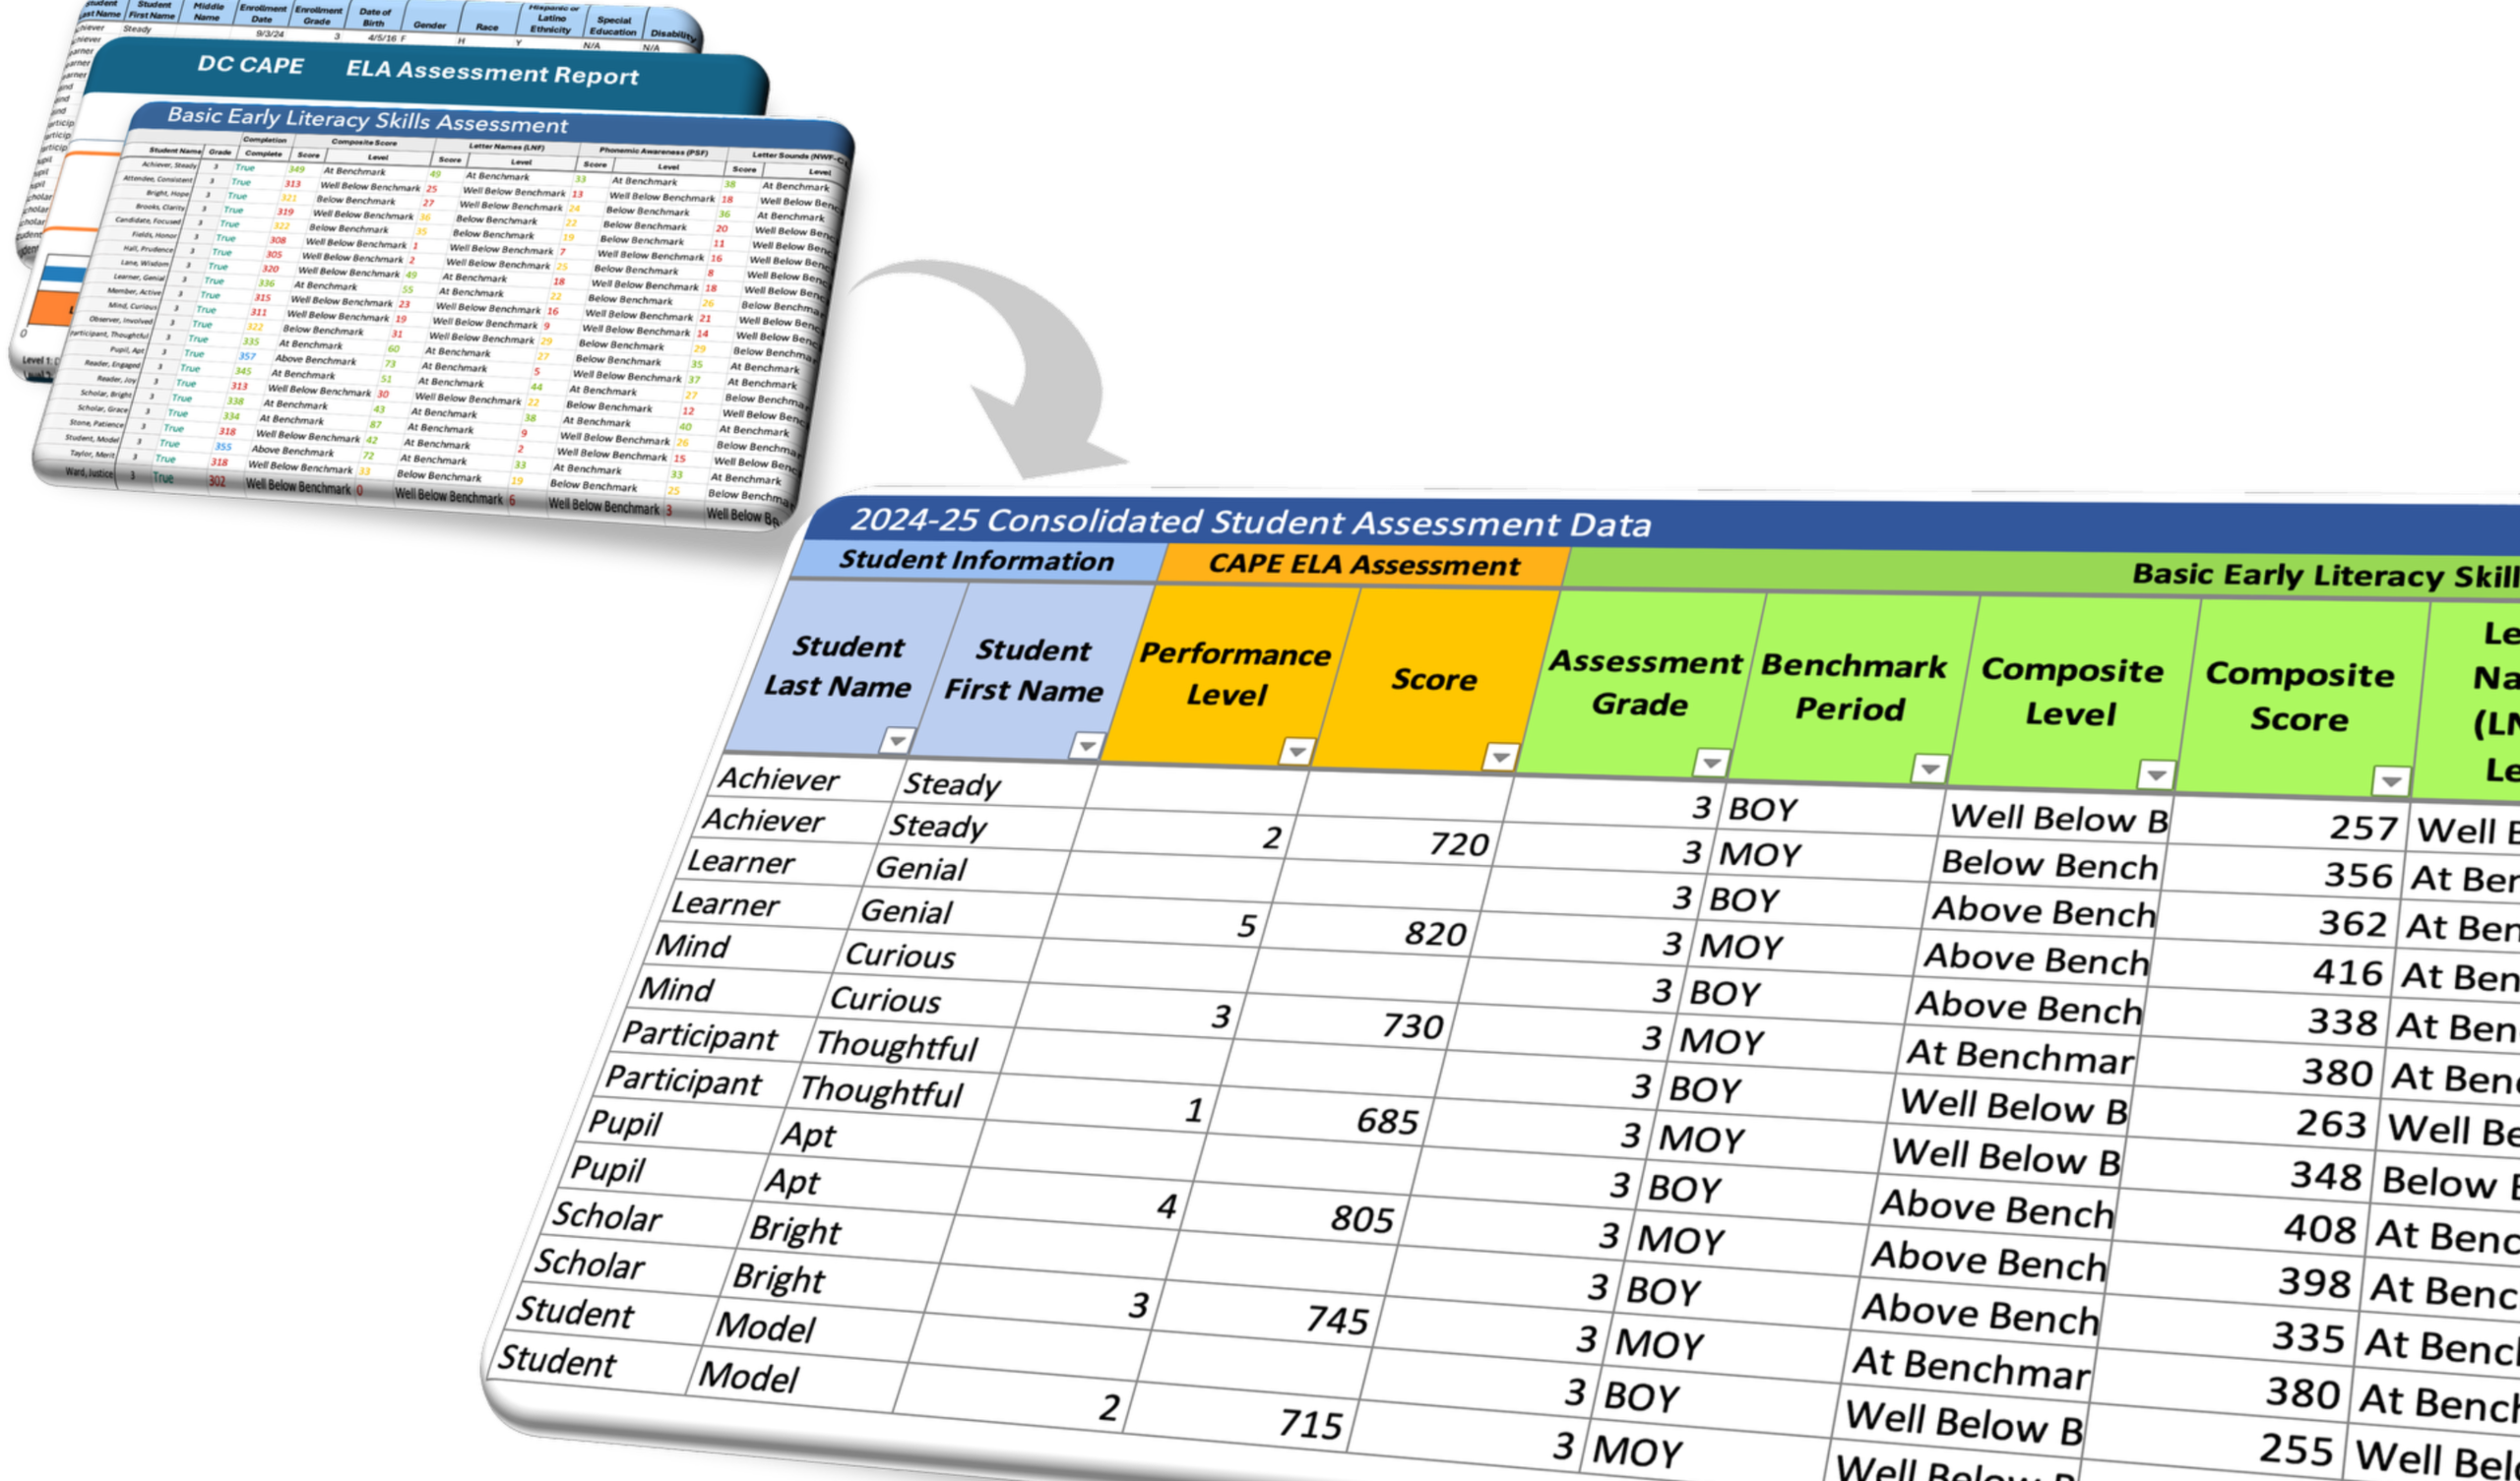
Consolidate student data with disparate sources and metrics
Student-level granularity plus aggregated views (grade-level, school-level, network-wide, etc.)
Privacy- and FERPA-aligned
Performance, Growth & Achievement Data
Pulled together from multiple sources
Universal Screeners
Diagnostic Assessments
Progress Monitoring
Demographic data
DC CAPE
Updates at each assessment period
BOY
MOY
EOY
Tables, Charts & Dashboards
Tables
Data accurately and clearly presented with filters, column headings, heat maps and more.
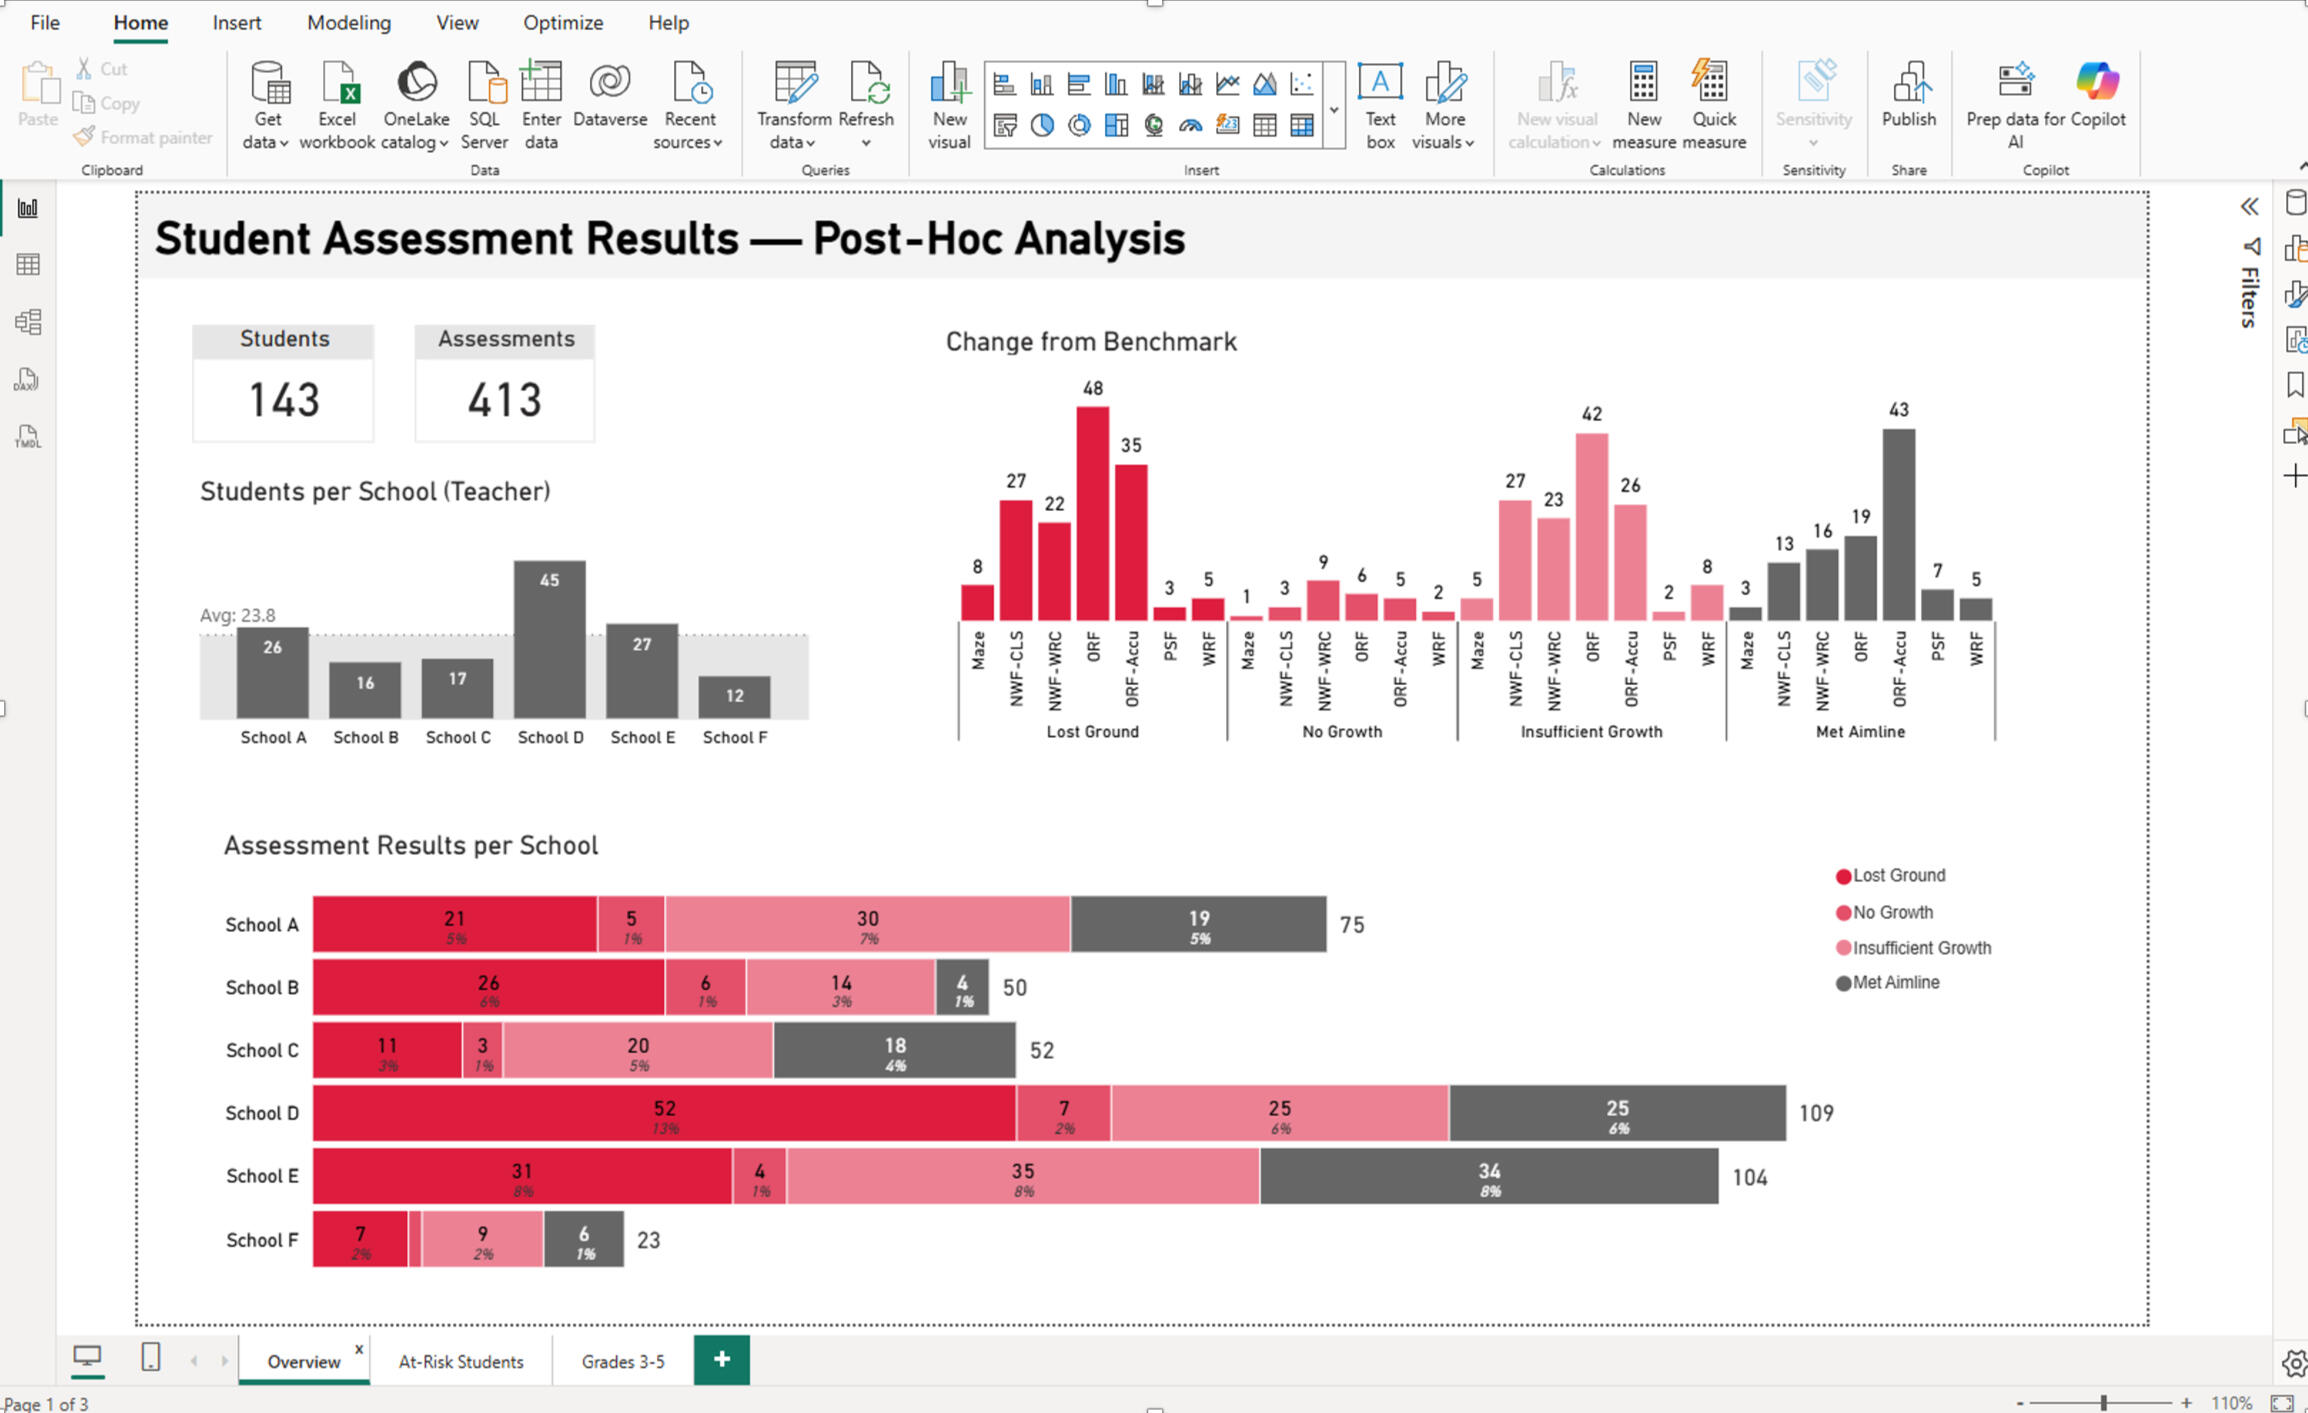
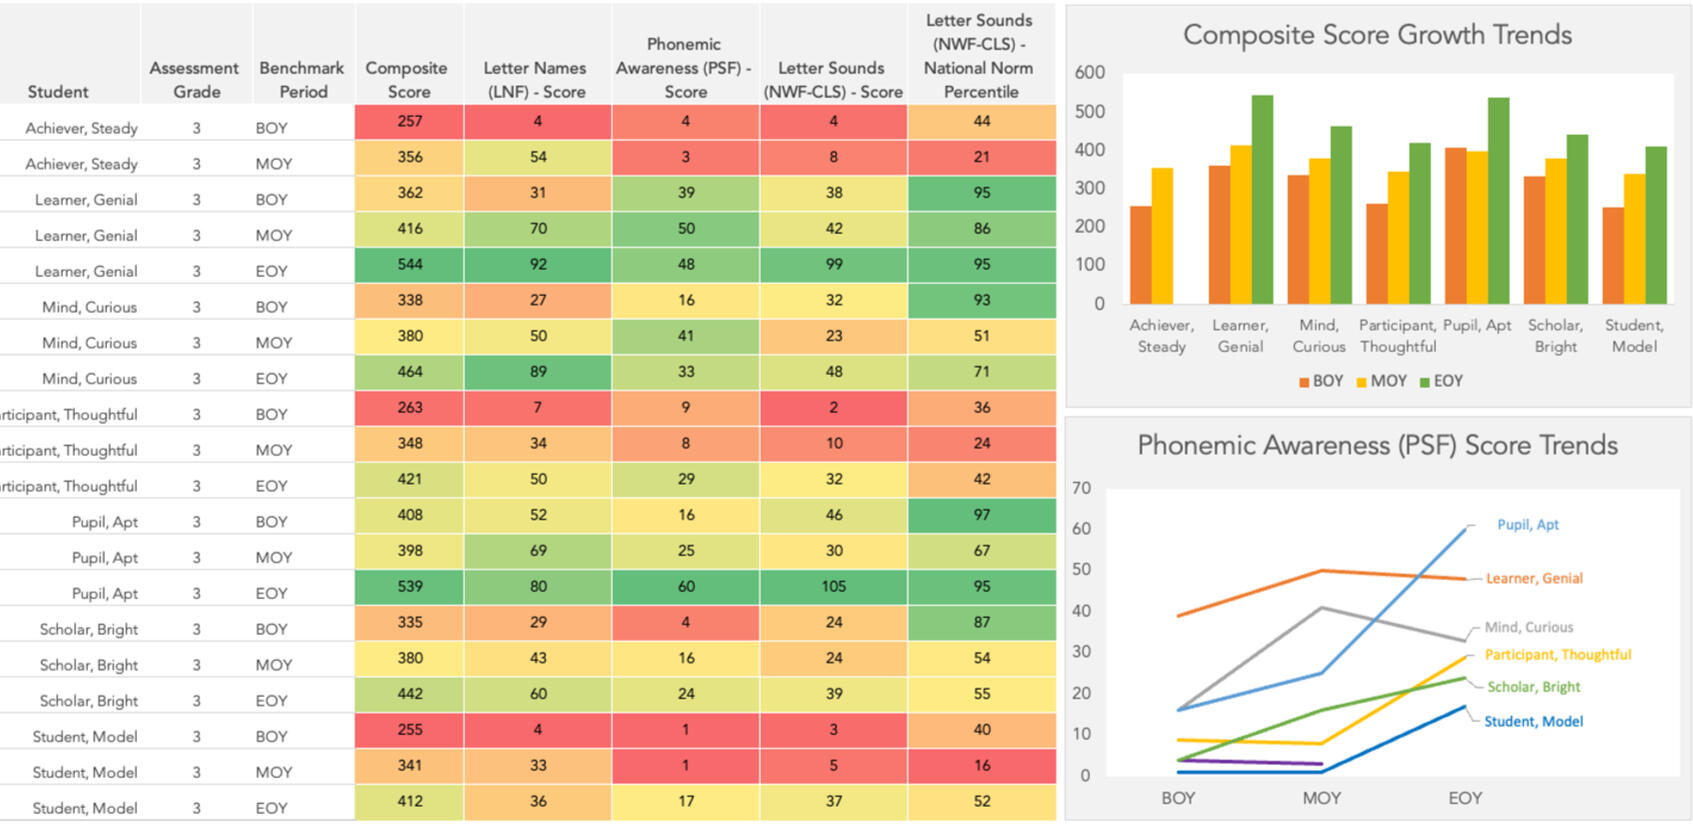
Charts & Dashboards
Visualizations make patterns and trends easy to see, highlighting insights that tables alone can’t. Smart use of color, chart type, and layout makes the data clear and compelling. Samples from two different client projects below show how I did this in Power BI and in Excel.
Power BI Post-Hoc Analysis Report
Excel embedded Composite Dashboard
About
Hey there! I'm Sanjay, and I'm so glad you're checking out my site. I enjoy meeting new clients and understanding the work they do. Here's a little about my background, and I hope to connect and learn more about you.I have over 20 years of experience using Excel and other analytics tools in corporate, startup and K-12 education settings, and hold several certifications including the Microsoft Power BI Data Analyst (PL-300) certification. I leverage this expertise to focus on my clients' needs and move them from messy and intimidating data situations to easy-to-use, accurate and compelling solutions to inform decisions and present to their stakeholders.
Pricing
Pricing based on project requirements, scope and requested deliverables.
I charge a flat hourly rate
Typical projects include updating a student achievement and growth table, plus 2-4 visuals
Typical updates take about 3-5 hours per assessment period
Let's Talk
Book a time to chat or send a short note describing what you are trying to do, what is not working, and what you need the file or report to produce.You do not need to have the solution figured out. A messy workbook, recurring report, or unclear process is enough to start.
© 2026 DATAFORK12.COM